

The HLTH Journal·Heart Health
HRV by age and sex: normal ranges explained
Your HRV changes as you get older, and it differs between men and women. There is no single perfect number that works for everyone.
HLTH Science Team· May 2026 · 4 min read

There is no single perfect HRV that works for everyone. What a normal reading looks like depends on your age and your sex, and more than either, on what your own readings have been doing over the past few weeks.
Key takeaways
- HRV falls with age because the parasympathetic nervous system becomes naturally less active.
- Women under 50 tend to have higher HRV than men of the same age; the gap narrows after menopause.
- A single reading tells you much less than a four-week pattern.
- Population ranges are a reference point, not a verdict.
Why HRV declines with age
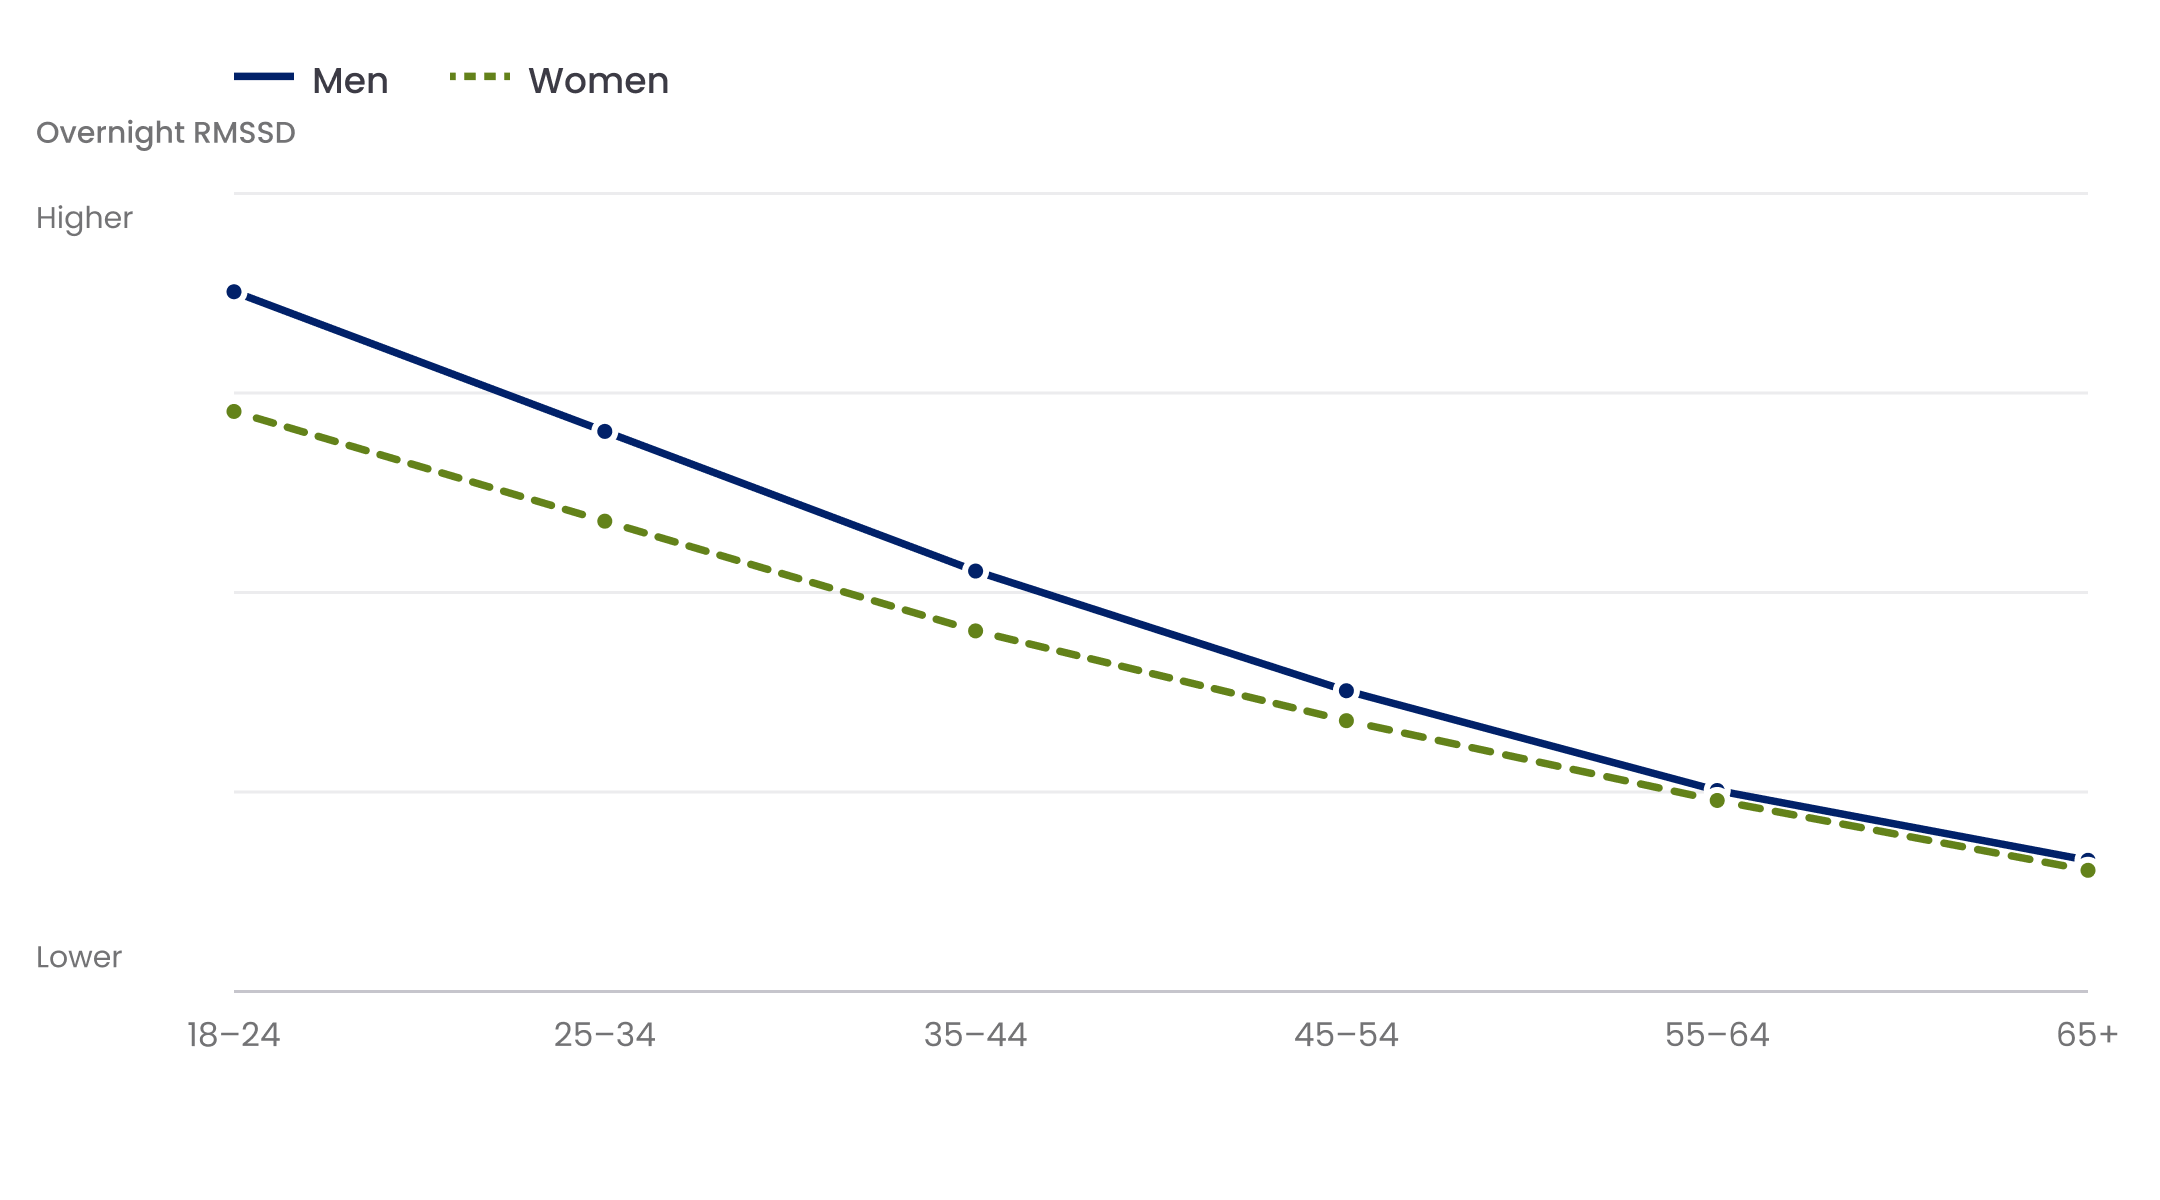
HRV is governed by your autonomic nervous system. As you age, the parasympathetic branch, the part responsible for rest and recovery, becomes naturally less active. The variation between your heartbeats gets smaller over time as a result. A 55-year-old with a lower HRV than a 25-year-old is not less healthy. They are simply older. What matters is how your number compares to others in your age group, and whether your own trend is moving in the right direction.
Why men and women have different ranges
Koenig J, Thayer JF. Neurosci Biobehav Rev. 2016;64:288-310Oestrogen increases parasympathetic nervous system activity, which is why women under 50 tend to have higher HRV than men of the same age. After menopause, as oestrogen levels fall, this gap narrows considerably. By the 60s, male and female ranges are broadly similar. Research confirms this pattern across age groups, with the difference most pronounced between 18 and 45.
What your result means
Sitting below the typical range for your group does not mean something is wrong. HRV is sensitive to last night’s sleep, alcohol consumed earlier in the week, travel, illness, and accumulated training load. A single reading tells you less than a four-week pattern. If your HRV has been consistently below your age-group range for several weeks and you cannot identify a lifestyle reason, it is worth speaking to your doctor.
Why your own trend matters more than any chart
Population ranges are a reference point, not a verdict. Two people with identical HRV scores can be at completely different points on their health curves. One might be improving from a prolonged low. The other might be declining from a strong high. This is why the HLTH Band spends the first two to four weeks establishing your personal baseline. The four bands in the app, low, normal, good, and excellent, are calibrated to you. A population chart tells you where you sit relative to your peers. The app tells you whether your body is moving in the right direction.
How the HLTH Band measures HRV
The HLTH Band measures RMSSD overnight using optical PPG sensors at the wrist. It does not track HRV continuously throughout the day, because movement artefact reduces accuracy during activity. The overnight window gives you the most stable and meaningful reading. Each morning the app displays your score alongside your minimum, maximum, and average values for the night.
Sources
Koenig J, Thayer JF. Sex differences in healthy human heart rate variability: a meta-analysis. Neurosci Biobehav Rev. 2016;64:288-310. Shaffer F, Ginsberg JP. An overview of heart rate variability metrics and norms. Front Public Health. 2017;5:258. Umetani K, Singer DH, McCraty R, Atkinson M. Twenty-four hour time domain heart rate variability and heart rate: relations to age and gender over nine decades. J Am Coll Cardiol. 1998;31(3):593-601. Nunan D, Sandercock GRH, Brodie DA. A quantitative systematic review of normal values for short-term heart rate variability in healthy adults. Pacing Clin Electrophysiol. 2010;33(11):1407-17.

